Google Search Console Keywords: Find the Ones That Matter
Search Console holds the only list of queries Google confirms you appeared for. Most people read the top ten rows and stop. Here is how to filter the rest into work worth doing.
By Richard Castro · September 11, 2026 · 9 min read
Search Console keywords are the only list of search terms that Google confirms your site actually appeared for. Not an estimate, not a sample from a third-party crawler: the real queries, with the real impressions, from the search engine itself. That makes the Performance report the most valuable and the most ignored screen in SEO.
Most people open it, sort by clicks, look at the top ten rows, and close the tab. The top ten rows are almost always your brand name and two terms you already knew about. Everything worth acting on is further down, hidden behind filters nobody touches.
Your top queries tell you what already works. Your rows 40 to 400 tell you what could.
What Search Console calls a keyword
Google does not use the word "keyword" in the interface. It says query, and the distinction matters more than it sounds.
A query is what a person typed. Search Console groups identical queries together and reports four numbers for each: impressions, clicks, click-through rate and average position. One query can map to several of your pages, and one page can appear for hundreds of queries. That many-to-many relationship is why the report confuses people the first time they filter it.
Position is the number that trips everyone up. It is an average across every impression in the period, weighted by nothing. A query sitting at position 8.4 might be at position 3 on mobile in Spain and position 14 on desktop in the United States. The average hides both. Before you celebrate or panic about a position, split it by device and country.
If you have not connected your property yet, start with setting up Google Search Console step by step and come back in a few days once data starts flowing.
Why your numbers never match Semrush or Ahrefs
Open Search Console and you might see 400 queries in the top 20 positions. Open a third-party tool for the same domain and it reports 60. Neither is lying. They count different things.
Search Console records every query that produced at least one impression, including a search typed once by one person in one country. Third-party tools maintain a fixed database of keywords they track, built from clickstream data and volume estimates, and they only report the ones in that database. Terms with no measurable search volume never make the list.
The practical consequences are worth internalising:
Your own site will always look bigger in Search Console than in any external tool. A competitor's site, measured by that same external tool, will look smaller than it really is. Comparing your Search Console numbers against a competitor's estimated numbers is not a comparison at all, and it is the single most common way SEO reports mislead the person paying for them.
Use Search Console to measure yourself over time. Use third-party estimates to measure competitors against each other. Never mix the two in the same chart and call it a race.
Where the keywords actually live
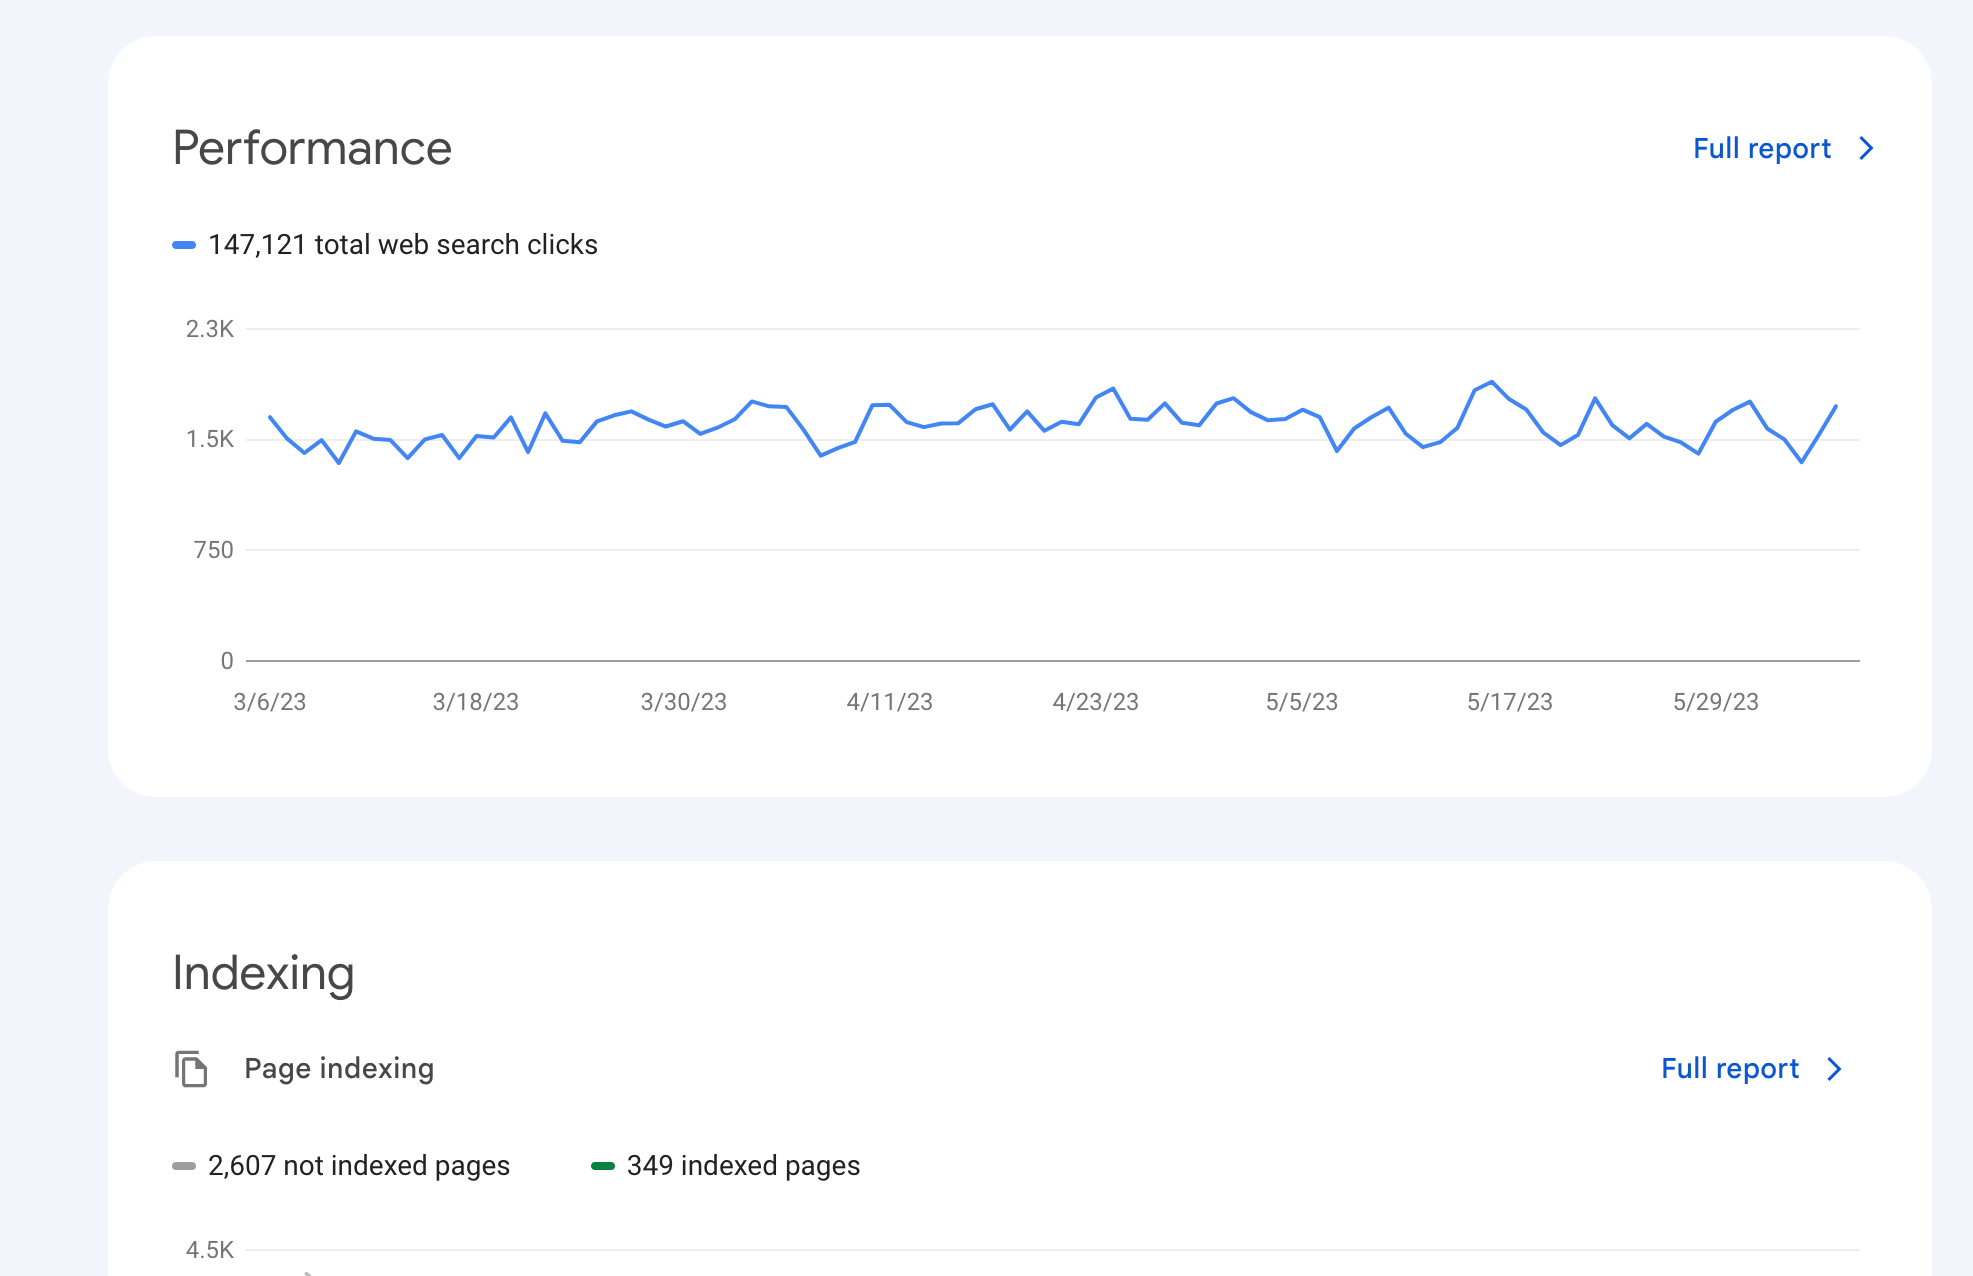
The overview screen is where everyone lands, and it is the one screen that tells you almost nothing actionable. The number of clicks over ninety days is a vanity metric. What you want is behind the Full report link in the top right of the Performance card.
In the left menu, open Performance → Search results. The default view shows the last three months with only Clicks and Impressions enabled. Turn on Average CTR and Average position with the toggles at the top, then scroll to the Queries tab below the chart.
That table is the whole game. Everything that follows is about filtering it into something short enough to act on.
Two things to change immediately. Set the date range to Last 28 days compared against the previous period, so every number carries a direction rather than sitting alone. And switch the country filter to your actual market if you sell in one country, because international impressions with no chance of converting will drag every average you look at.
Four filters that turn a thousand rows into a short list
Positions 11 to 20
Filter position greater than 10 and less than 21, then sort by impressions. These are queries where Google already considers your page relevant enough for page two. Moving one of them up three places usually needs a better title, a section that answers the query directly, and two internal links, not a new article.
This is the highest-return filter in the entire report, and we covered the workflow in depth in striking distance keywords.
High impressions, no clicks
Filter impressions above 100 and CTR below 2 percent. Google is showing your page to a lot of people who choose something else. The page ranks; the listing does not persuade.
Nine times out of ten the fix is the title tag and the meta description, and the cheapest test in SEO is rewriting both and waiting two weeks. Our guide to improving CTR in Search Console has the patterns that move the number.
One query, several pages
Click any query, then open the Pages tab while the query filter is still applied. If three of your URLs appear for the same term with similar positions, you are splitting your own signals.
Pick the page that should own the query, point the other two at it with internal links, and consider merging thin ones. The full diagnosis lives in keyword cannibalization.
Queries that are new this period
Compare the last 28 days against the previous 28 and sort by impression difference. Queries that appeared from nothing are Google testing your page against a new intent. They are early, they are cheap to capture, and almost nobody looks at them.
If impressions dropped instead across a group of related queries, that is a different investigation: start with diagnosing a traffic drop.
The limits nobody warns you about
Three hard limits shape what you can do with this data, and knowing them saves hours of confusion.
The interface exports 1,000 rows. Not the first thousand of your choosing: the top thousand by clicks for the filter you applied. For most sites the interesting terms sit well below that line, which is why filtering before exporting matters more than exporting everything.
Data expires at 16 months. There is no archive. If you want year-over-year comparisons beyond that window, you have to be storing the data yourself before you need it.
Some queries are hidden. Google withholds terms searched by very few people to protect privacy, labelling them as anonymous. The clicks still count in your totals but the query never appears in the table, which is why the sum of your rows rarely matches the chart above them. On smaller sites this can be a quarter of all impressions. There is no way around it, and finding hidden keywords is about working with what remains rather than recovering them.
Getting the data out of the interface
The 1,000-row export is the ceiling for anyone working in the UI. Past that, three routes exist and they suit different readers.
Google Sheets is for one-off analysis you want to slice by hand. Looker Studio connects natively and refreshes on its own, which makes it right for a dashboard somebody else reads every week. The API returns 25,000 rows per request instead of 1,000 and is free to use, which makes it the only real option once you care about the long tail or need to keep history past 16 months.
We compared all three, with the setup steps and the reason to pick each, in connecting Search Console to Sheets, Looker Studio and Power BI. If you are heading straight for the API, the quotas and limits are worth reading before you write the first request, because the per-minute caps are lower than most people assume.
Turning the list into work
A filtered list is not a plan. What converts one into the other is deciding, for each query, which of three things it is.
A page that exists and underperforms needs an edit: a rewritten title, a section that answers the query in its own words, internal links from your strongest related pages. This is most of the list and most of the return.
A page that does not exist needs writing, but only when several related queries point at the same gap. One query at position 45 is noise. Twelve related queries at position 30 and above is a brief.
A query you should ignore is the third category and the one people skip. Terms with the wrong intent, the wrong country, or the wrong buyer will never convert no matter how well you rank. Deleting them from the list is work, not laziness.
Set a cadence you can keep. Once a month is enough for most sites: filter, pick five items, do them, and check the same filters next month. Weekly checking of a metric that moves on a two-week delay produces anxiety, not rankings.
Where tools fit
Everything above can be done by hand in the Search Console interface, and for a site with a few hundred queries that is a reasonable way to work.
It stops scaling the moment you manage several sites or your query count passes a few thousand. At that point the bottleneck is not access to the data, it is the hours spent filtering, cross-referencing pages against queries, and writing the same three recommendations again. That is the work Search Console tools exist to absorb.
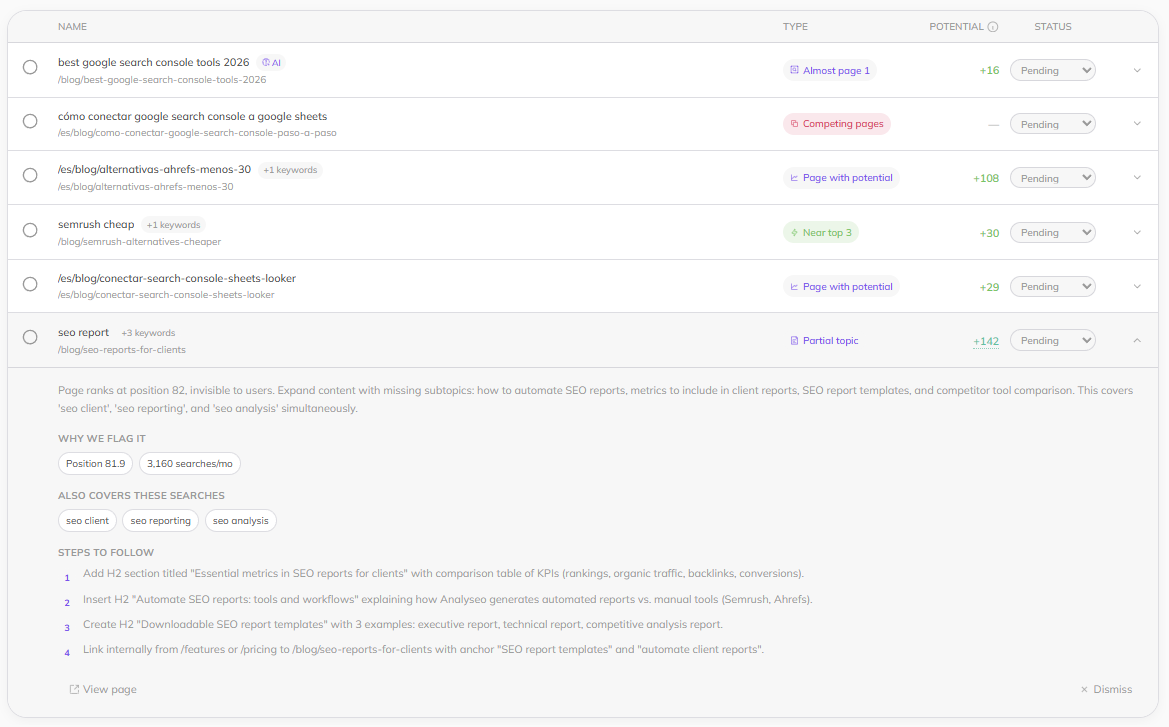
AnalySEO connects to your Search Console property and runs those four filters automatically, then explains each finding in the same terms this article uses: what changed, why, and what to do about it. Every row above came out of the filters in this article: a page sitting just off page one, two URLs competing for the same query, a post ranking at position 82 for a term with 3,160 monthly searches. You can also ask it questions about your own data in plain language, which is closer to how using ChatGPT with Search Console works, except the data arrives already connected.
The tool is not the point. The point is that the answers to most SEO questions about your own site are already sitting in a report you can open right now, and almost nobody scrolls past row ten.
Frequently asked questions
What is the difference between a keyword and a query in Google Search Console?
Search Console reports queries, which are the exact terms people typed, not keywords you chose to target. Each query carries impressions, clicks, CTR and an average position. One query can show several of your pages and one page can appear for hundreds of queries, which is why the same URL shows up repeatedly when you filter the table.
Why does Search Console show more keywords than Semrush or Ahrefs?
Search Console records every query that produced at least one impression, including terms searched once by one person. Third-party tools only report keywords in their own database, which excludes anything without measurable search volume. Your site always looks bigger in Search Console, so never compare your Search Console numbers against a competitor's estimated numbers.
How many keywords can I export from Google Search Console?
The interface exports 1,000 rows, chosen by clicks for whatever filter you applied. The Search Console API returns 25,000 rows per request and is free to use. If your site has more than a thousand ranking queries, filter before exporting or move to the API.
Why do some of my Search Console queries not appear in the table?
Google hides queries searched by very few people to protect user privacy. Those clicks still count in your totals but the query never appears in the rows, which is why the sum of the table rarely matches the chart above it. On small sites the hidden share can reach a quarter of all impressions.
How often should I check Search Console keywords?
Once a month is enough for most sites. Position and impression data move on a delay of one to two weeks, so checking weekly shows noise rather than progress. Set a monthly cadence, pick five items from your filtered list, complete them, and review the same filters next month.